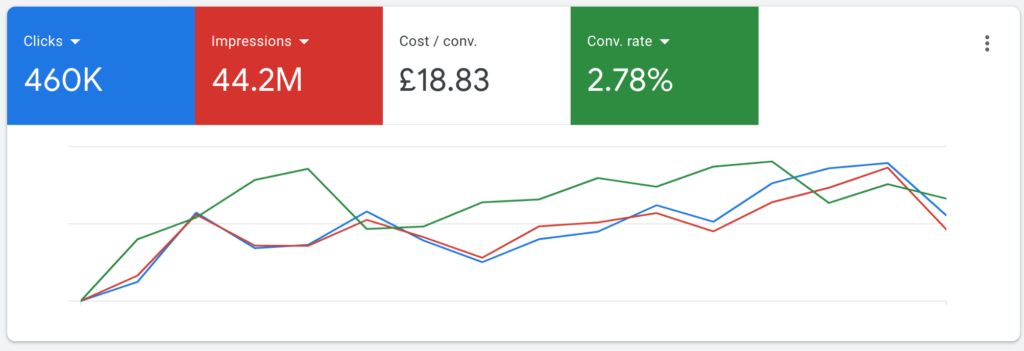
TOP GOOGLE ADS METRICS TO TRACK
1. Impressions / Number of Impressions
The number of times your ad displays (impressions), either for SERPS or Google’s Ad Network, will give you an overview of levels of exposure to target audiences for campaigns being deployed. An impression happens when potential customers see your ad, having searched on a keyword or phrase. Ads appear at the top or bottom of this page following Google searches; across Google’s networks, ads may appear elsewhere, e.g. in a headline, or side box or as a page footer; banners can appear in various pre-selected positions too.
If you choose Google’s Display Network, your ads will appear on their network’s web-pages, e.g. on a newspaper, journal or relevant business page. Choosing this option is invaluable for building brand awareness.
2. Click Numbers
When someone clicks your ad, either on the blue headline or your text ad phone number, these count in Google Ads as clicks, regardless of whether the clicker accesses your website or not. This shows up as a gap between ad clicks and website visits and can indicate a technical glitch with your website to address.
Click numbers give insights into how appealing your ad is, how relevant and whether highly targeted. Check your CTR to check ratio of click numbers to any actions taken next. Good matches between keywords in your ads with subsequent landing pages will demonstrate relevance to your potential customer. Clicks to sales demonstrate effective targeting.

3. Cost Per Click (CPC)
CPC is the average amount you’re charged per click on your ad. Some drilling in is needed here.
Your average CPC is based on your actual cost per click (actual CPC)…” i.e. your fee for each ad click, says Google. Avg. CPC ”… is calculated by dividing the total cost of your clicks by the total number of clicks”.
In Campaigns, you may find your average CPC can differ from your maximum cost per click (max. CPC), i.e. the highest amount you will pay for a click.
If this leaves you somewhat befuddled, let’s share an example:
Your ad gets two clicks; one costs £0.40, the other £0.60; thus your total ad cost is £1.00.
Then: £1.00 / 2 = £0.50 average CPC
An exception here is Hotels, for which you should check Google’s guidance, as there is more to consider given that your max CPC is multiplied by the number of nights in the itinerary.
Use Keyword Planner or similar paid tools such as SEMrush for an estimated average CPC for your Search Network campaigns.
4. Click Through Rate (CTR)
Click Through Rate is about the number of clicks an ad generates, or how many views turn into clicks through. This performance figure is important to gauge interest levels in your target audience. It is often used not only in Google Ads, but in email campaigns and banners too. This metric helps you build your understanding of volume of clicks during any given period and perhaps more importantly, how trusted your message is.
Consider how many clicks your ad has ‘purchased’, for instance with an impressions campaign, versus a sponsored ad appearing against particular searches. CTR complements CPC in building a picture of customer behaviours against ad content and placement.
This is perfect metric to build split testing campaigns on. Tweaking single variables for direct comparison of performance helps you consistently improve your CTR, your understanding of customer motivations and sales in turn.
Google advise that “a good CTR is relative to what you’re advertising and on which networks”. Other impacts on CTR success include attractive graphics, effective keywords and targeted, compelling messaging and ad copy.
5. Conversions / Number of Conversions
Similar to CPA in so much that you are looking at returns on ad spend, except that conversion cost and ad spend alone do not give you the whole picture. You really want to be looking at the bigger picture of total conversions altogether for a campaign.
Of course, the meaning of cost per conversion is also not always clear cut, depending upon business objectives. For instance, you may want to differentiate between sales conversions, subscriber numbers to newsletter, downloaders of your app or other assets, or even social media engagement figures. The point is that an action adds value to your organisation.
Google Analytics allows advertisers to track conversions easily.
6. Conversion Rate (CR)
Conversion Rate describes your all-important ratio of clicks to conversions from your ads in percentage terms. Low conversion rates can make Pay Per Click campaigns very costly, very quickly, so understanding this metric is important to manage your budget.
Your perception of what constitutes a low or high conversion rate may change over time as you learn what works and as you consistently monitor CR metrics to improve your performance. A conversion rate of e.g. 0.1-0.5% may be too low a tolerance for ROAS targets. The risks of high costs of each sale mean squeezed margins and unsustainable campaigns.
Ad traffic should deliver hot to purchase leads, versus ‘Looky-Lou’s’. Compare your Google Ads CR with results from other marketing channels in Google Analytics thus:.
- Take your number ofconversions; divide that by your total tracked ad interactions which demonstrate a conversion during a specified time period. Google’s example: 50 conversions from 1,000 interactions, means your conversion rate is 5%, ie 50 ÷ 1,000 = 5%.
- When tracking more than one conversion action, or you choose to count “Every” conversion, your CR could show more than 100%, as more than one conversion gets counted for each click.
- Useconversion tracking in your account to measure your conversion rates and ultimately to help guide your advertising decisions.
7. Cost Per Action (CPA) / Cost Per Conversion
Your average Cost Per Action is how much it costs you on average to achieve a new customer taking action in your array of sales processes. This is essentially a lead tracking metric which helps identify sales funnel gaps, as well as granular costs of different campaign objectives.
If you have an online shop, these figures are easy to track and average out, because you are simply looking at sales. You can check CPA by adding the cost of your ads in any particular campaign, then dividing by the number of conversions or actions.
If you are not a shop, with more than correlations between items sold and profit made to consider in actions you want customers to take, then the calculation is obviously more involved. For instance, when trying to establish viability of sponsored ads in relation to triggered phone calls, which turn into purchases or bookings, because there are on and offline metrics, the picture is less clear.
Here, cost (or price) per action can be established over time, as you record your spend against calls coming from Google Ads that convert into sales. However, this assumes that you are disciplined enough to ask your customer how they found out about your service and that they know the difference between clicking on a paid ad and clicking links into your organic website content! Needless to say, this might not be an exact science, unless perhaps you offer discount codes, so you know exactly which ad generates the call; such techniques make for more objective tracking.
Each business is different and variables will differ. For instance competition on keywords directly impacts ad cost per click and cost of action metrics in turn. Conversion rates will also differ according to ad placement, format and content.
When reviewing your Google Ad CPA metrics, focus on how many leads convert into paying customers. Track how many sign up for news from you via email and how many move from here into sales. If you are seeking to expand brand awareness, perhaps look at numbers of people who visited your site that are unique visitors and who returns to your site to buy in. Immediate buyers are your short term sales cycle successes where costs are more easily calculated. Some customers need longer to build trust in you before making their purchasing decisions in their own time; this requires dedicated time for analysis.
Be sure to review the value of each sale in relation to your clicks through.
8. Total Conversion Value (TCV)
Total Conversion Value gives your overview of decreasing or improving performance in terms of returns; while profits may change, the number of conversions may not be. So, for instance e-commerce sites can look at an average order value (or size of customer basket) and work towards increasing this value, regardless of sales numbers; if sales numbers do not change, but basket size improves, a retailer is moving in the right direction for profitability.
Understanding TCV, together with ROAS and CPA indicate direction for future advertising investments.
9. Return on Ad Spend (ROAS)
A definition of Return on Ad Spend (ROAS) is your ratio of Google ad spend costs compared to revenue profits this investment generates. This is one of your essential Google metrics to review when assessing overall performance of your Pay Per Click ad campaigns.
To Calculate the ROAS, you simply need to divide your total generated revenue by the total ad spent and multiply by 100. For example; $5 in sales ÷ $1 in ad spend x 100% = 500% ROAS.
Your ROI calculation is straightforward too. Simply, find your revenues resulting from your ads and listings. Next, subtract your overall costs from revenues, then divide by your overall costs. Google’s formula here is: ROI = (Revenue – Cost of goods sold) / Cost of goods sold.
Generally, it is a very simple calculation to make, so let’s share an example from a client’s recent campaign:
Total Google Ads Investment: $110,000
Total Revenue (Conversion Value): $490,000
Total Cost of Goods Sold: $160,000
Total Return On Ad Spend (ROAS): 445%
ROAS = 490,000/110,000 => 4.45 i.e. they made 4.45x or 445% their initial investment in returns on ad spend, or in other words, for every dollar spent, they got $4.45 back.
Total Return On Investment (ROI): 81.4%
ROI is a more meaningful measurement of profitability as it takes into account the overall costs including the cost of goods as well as the ad spend. ROI = (490,000 – (110,000 + 160,000)) / (110,000 + 160,000) = 0.814 = 81.4%
10. Quality Score (QS)
Quality Score monitoring helps you drive down Google advertising costs, thereby increasing profitability, sustainability and scalability of your ad campaigns. Developing a highly structured campaign strategy around your keywords helps you consistently improve your QS on a scale from 1-10, so you can be confident of steadily improving your campaigns.
In particular, Quality Scores is calculated based on:
- Website landing page performance and how relevant the page is to your ad.
- Ad relevance and how your ads match the intent of the user’s search.
- Expected CTR; how likely is it for you ads to be clicked by the user.
These 10 Pay Per Click metrics combine to give your marketing teams an overview of Google Ads performance and granular insights to tweak, compare and incrementally improve upon campaigns in order to generate more return for less investment. It’s a forever on-going process of reviewing, tweaking, deploying.
- Written by: Sam Nouri
- Posted on: February 6, 2022
- Tags: Google Ads


