
Most Important Facebook Ads Metrics to Keep an Eye On
Measuring marketing outcomes matters. How else will you know if your marketing investment is returning hoped for profits? How else could you plan incremental improvements? How will you know how you measure up against your competitors?
Facebook is the social media advertising market leader. Chances are your competitors are here. It’s essential to understand your Facebook advertising performance metrics for your business to remain competitive here. There is much to review, so what to prioritise during set up for your niche? Well, the good news is that campaign structures are not too dissimilar. That being said, let’s look at the detail.
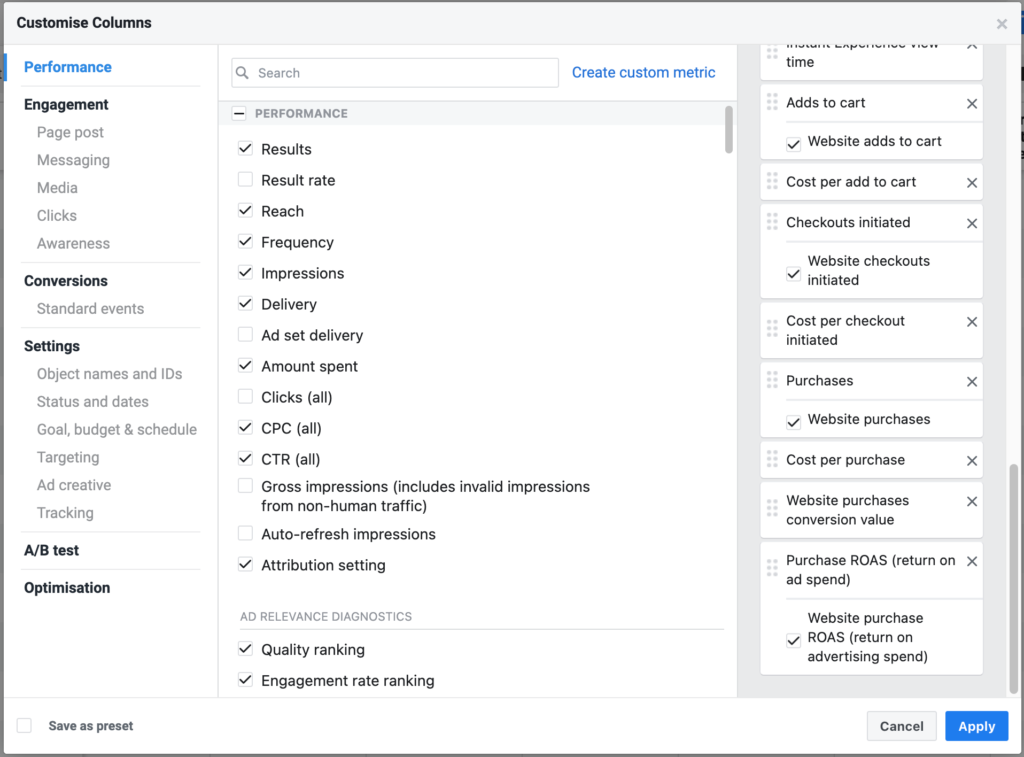
First off, understand that accepting Facebook default ‘Presets’ is not recommended. Set the columns as you see fit for your business. Here is Facebook’s guide on how to customise your columns in Ads Manager.
Now, onto your most important Facebook metrics to keep your eye on…
Impressions
As the name suggests, ‘impressions’ measures the number of times your ads display to your target audience, says Facebook’s guidance. Normal parameters are CPM, i.e. cost per thousand (not ‘million’, the ‘m’ is the Latin; don’t get caught out here!); thus you set your bid for your ad to show up one thousand times.
It’s important to be aware of what ‘display’ means in reality. So, the first time a fixed or video ad shows up counts as one impression. If a Facebook user sees your add, scrolls down, then scrolls back up to your ad, this is only one impression. If your ad appears to someone twice in the same day, this counts as two impressions.
Be aware that whether a video ad is played or not, still counts as one impression for this ad format, so decisions on format are important on this platform.
Occasionally, Facebook’s system cannot determine whether an ad is on screen, for instance, for feature mobile phones, impressions will still be counted as device deliveries. This makes it essential that advertisers ensure their ad’s are appropriately formatted in order to not waste money from incompatibility.
Cheating the system, by so-called ‘black hat’ tactics like deploying bots, that amount to “invalid traffic”, to ‘view’ an ad will not work.
CPM helps you gauge cost-effectiveness of your advertising campaign in terms of whether people are clicking through. It’s also “…often used to compare performances between different ad publishers and campaigns”, Facebook tells us.
For assessing CPM effectiveness, calculating begins with your total ad spend for any Facebook advertising campaign, then divides this by the number of impressions, then multiply by 1,000. For example, if ad spend = £50 for 10,000 impressions, CPM = 50.00/10,000 i.e. £5.00
Reach
As this suggests, this is about the number of people who are exposed your ad, but isn’t an accurate measurement of how many actually SEE it, or click on it; it is therefore, an estimation.
Audiences will be more likely to engage with messages appropriate to their interests, which may seem obvious, but relevance is all in the caaption and image combination set up. Split testing a campaign for your audiences can help measure which content works best and improve conversions.
Success is also measured depending upon your budget available and bid strategy. This skill comes with monitoring results carefully.
Frequency
Frequency is the estimated average number of times each person sees your Facebook ad. This is about your strategy for building awareness and familiarity with your brand or product. So, multiple shows enables customer recall, builds trust, thus encouraging confidence in clicking. Various research suggests that customers need to see an ad between 4-7 times before they will click. This setting is geared to this consideration.
Measuring frequency, together with results and ad relevance diagnostics ensures people are not seeing your ad too often during a campaign run. When performance drops alongside rising frequency, this could suggest ad fatigue and a good time to freshen up the ad content.
This figure could be set to one, two, or more for your ad set. Additional considerations here are your budget, schedule and audience size. It is calculated using sampled data thus: Number of impressions divided by reach. E.g. 1,000 impressions / 500 people = 2
Link Clicks
Link clicks measures the number of clicks on ad links customers make that result in them reaching the pre-specified destinations of an advertiser. Such clicks (through) may be to pages on or off Facebook.
Link clicks help gain insights into interest levels for your ad campaigns. Facebook advertisers monitor click-through rate to measure of success for their advertising campaign and may be compared with other campaigns on Facebook or against alternative channels.
Clicks also help you see what happens after a potential customer clicks on your ad. Compare your link clicks to other metrics, such as sales page sources i.e. Facebook ad’s versus another social media ad, or e.g. YouTube video.
To calculate successes with link clicks, monitor clicks based on ad text, images, media or calls to action. Relative numbers tell you more about your preferred customer connections and journeys.
Be aware, however, that this Facebook metric “… excludes clicks on content…”, or your post’s comments section.
Remember, your ads may point to various destinations, depending upon your campaign priorities. So, your ad’s headline could link to one destination, but your call to action can link to another, either on or off Facebook. This allows you to gain insights into appeal of:
- Web pages
- App store downloads, or app ‘deep links’
- Telephone number clickable link
- Contact page messaging
- Business location and map direction links
- Shops
- Lead forms (e.g. for newsletter sign ups)
- Marketplace
- Instagram profiles to boost social media platform views
- Playable experiences
- Videos that launch the Watch and Browse experience
- Alternate website videos (including those embedded in News Feed ads, but hosted via e.g. YouTube or Vimeo)
Landing Page Views
“Your landing page views metric may be in development and estimated”, Facebook advises us.
After you create your ‘Meta pixel’ , you will be able to produce reports on success of landing page hits from Facebook ad links. Alternatively, ‘Instant Experience’ helps build your brand awareness in a variety of ways.
This metric shows you how many times Facebook users load your pre-set webpage, or Instant Experience, having clicked your ad. Split test links to understand how many people click on your ad and view your chosen destination or click away before the page or Instant Experience loads. This helps you understand the psychology of your audiences and improve on performance of ads.
When someone loads your web page or Instant Experience after clicking your ad, this is counted as a ‘view’. Sometimes these cannot be counted directly because of “…partial or missing data…” In such circumstances, statistical modelling may be used to account for events.
Cost Per Link Click (CPC)
CPC shows the average cost of each link click. This helps you assess ad efficiency and effectiveness, for instance against sales value. It is one of your essential overviews for campaign management.
Cost per (link) click is calculated from taking total amount of your ad spend divided by the number of customer clicks.
Cost Per Landing Page View
Cost per landing page view, as you would imagine, helps calculate the average cost of each view of your pre-set landing page.
Calculation involves your total amount of ad spend, divided by landing page view numbers.
Be aware that this metric comes with a caution that it is still being tested by Facebook, so stay tuned for developments.
Click Through Rate (CTR)
Your click through rate is another key metric to show the percentage of link clicks against ad impressions or displays. So, CTR indicates the appeal of your Facebook advertisement and relevance to the ultimate destination; for success of an ad, there must be coherence between ad content and offering once customer has clicked through. For understanding how well yours ads are driving traffic to your chosen destination, CTR is key.
CTR is calculated by noting your of link click number, then dividing this by the number of impressions.
Leads
Lead generation is your business life blood, so this is an essential metric. Tracking your leads will require setting up your website’s Facebook pixel for generating tracking for website reports on lead generation success, i.e. how many ‘events’ happen following clicks, as well as when and where those steps taken by customers happen i.e. the website pixel installation helps track those crucial conversions from Facebook ads.
This ‘leads’ metric counts when the pixel tracks Facebook ad related events. Thus you know when e.g. sales can be attributed to your Facebook ads, versus other sources.
Adds to Cart
Needless to say, the Facebook ‘Adds to Cart’ metric pertains to e-commerce. Your website installed Facebook pixel lets you track from the point of a Facebook ad click, through to conversions, with your ‘Conversions API’. This helps track purchases attributed to different campaigns you may run. Be aware that Facebook warns that sometimes, “…this metric may be estimated.”
Your Adds to Cart metric counts when the Facebook pixel or Conversions API tracks an event, attributed to your ads, but note that “events may be counted differently based on the attribution setting …”; this is determined in your set up.
There may be circumstances where events cannot be directly counted because of partial or missing data; in those cases, statistical modelling may be used to connect less clear events.
Initiated Check Out
Initiated check out is, as you would imagine, another ecommerce tracking metric. This helps calculate the number of initiated checkout events associated with your ads, according to information gleaned from your Meta Business Tools. This metric, too, may be estimated and reported by a third-party API.
This metric counts initiated checkout events, which get tracked by a Facebook Business tool, “…such as a Facebook pixel, Conversions API, app SDK or offline event set…” This is attributable to your differing ads. Set up has a bearing on calculations here, so “events may be counted differently based on the attribution setting…” that you select. Partial or missing data may require statistical modelling for reporting some events.
Facebook advises a further limitation in this metric, eg “results reported for iOS 14+ campaigns”. Calculation isn’t always possible with this parameter.
Purchases
Every e-commerce entrepreneur needs to know how the revenues will be generated and how to maximise them. The Purchases metric is one of your most important numbers to analyse. It counts purchases that happen via any attributable Facebook channel, i.e. Marketplace, Instagram Shopping or ad check outs.
It will supply your purchase numbers attributed directly to particular ads, via Meta Business Information Tools, i.e. “Facebook pixel, Conversions API, app SDK or offline event set”. As per other FB metrics, it isn’t always exact and, Facebook advises “reported by a third-party API”.
Events are counted according to pre-selected attribution settings. Statistical modelling may also be required in some circumstances. Results reported for iOS 14+ campaigns, may not be calculated with the Purchases metric.
Cost Per Purchase
All purchase values are different, the cost per purchase metric calculates your average cost for each e-commerce purchase. It is calculated as your total ad spend, divided by your total purchase number, for a selected time period . Missing data involves modelling for some events. iOS 14+ campaigns may not be calculated.
Purchase Conversion Value
The value of a sale is in some senses, more important than your average value, because the ideal is to increase purchase value against click numbers. Your total value of purchases is tracked along with Conversions objectives. This metric may be estimated, but is calculated by:
“…adding the value parameters that you set for the purchase conversion standard event”. This is not always an exact science, as per previous metrics. iOS 14+ campaigns may not be calculated.
Purchase ROAS (Return on Ad Spend)
Another essential ecommerce metric, ROAS gives you a campaign overview in terms of total returns from website purchases vis a vis campaign investment. It takes the value of all conversions recorded by Facebook’s pixel or Conversions API on your website attributed to your ads. It is also another metric that in some circumstances can be estimated.
The calculation comes from website purchases conversion value, divided by total amount spent on your campaign. Statistical modelling may be necessary “…for some events, as well as for the values assigned to those events.”
Mobile App Installs
For campaigns focussing on new app promotions, mobile app installs will demonstrate app popularity; uninstalls are as important as downloads. So this metric is an ‘app event’ attributable to trackable ads. A count occurs when a user opens your app for the first time.
For iOS 14+ campaigns, Apple’s SKAdNetwork API reports results, based on the time these events get reported to Facebook. For ads and ad sets statistical modelling may be necessary for some events.
In terms of games, mobile app installs get logged by the Instant Games SDK. The number of times a person loads your game is counted, as well as when Terms of Service are accepted for the first time.
Cost Per App Install
For campaigns focussing on new app promotions from ads, you need to know your average cost for each app install, albeit, once more, this metric may be estimated and reported via a third-party API.
This cost management metric is calculated as the total amount spent during your selected ad run period, divided by app installs that occurred within that time.
Calculations are not always exact, as per other metrics and for iOS+ 14 campaign reporting, this metric may not be possible.

- Written by: Sam Nouri
- Posted on: February 20, 2022
- Tags: Facebook Ads