MER vs ROAS: the argument is a decoy.
Switching from ROAS to MER fixes nothing on its own, because the two are the same fact stated in opposite directions. What actually decides whether you scale or cut is the number underneath both of them: which revenue you divided by, and whether anyone wrote down which one counts.
What changed in this revision: Added a table converting contribution margin into breakeven and ceiling targets in both MER and ROAS form, a 2026 section on GA4 key events and the move to data-driven attribution in Google Ads, and labeled the spend threshold as judgment.
Use MER to govern the business and per-platform ROAS only to move money inside a single platform. That is the correct answer, it is what every article on this subject says, and on its own it will not save you a penny. MER and blended ROAS are the same economics written in opposite directions (one is spend over revenue, the other revenue over spend), so swapping one for the other changes which way the number moves and nothing else. Both inherit whatever revenue figure you fed them. If that figure came from the platform being graded, you have not escaped attribution bias by dividing differently. You have relabeled it.
The decision that actually matters is upstream of the ratio: of the three or four different revenue numbers your stack can produce for the same week, which one counts. Almost nobody writes that down. So the number gets picked per meeting, usually by whoever needs to justify a position, and the business ends up with a measurement system whose output depends on who is presenting.
The two ratios are one fact, and the convention matters
MER, marketing efficiency ratio, is total ad spend divided by total revenue, expressed as a percentage, where lower is better. A MER of 25% means a quarter of your revenue is going to ads. Blended ROAS is the same relationship inverted: total revenue divided by total ad spend, where higher is better. A 25% MER is a 4.0x blended ROAS. They are not two measurements. They are one measurement and a choice of direction.
Which means the only real hazard here is the unit. MER circulates in the wild in both forms: as a percentage where lower is better, and as a revenue-over-spend multiple where higher is better. The two have opposite directional instincts. We standardize on the percentage internally, because it composes with everything else on a P&L, which is also stated as a share of revenue.
The failure mode is not confusion, it is a target. The moment someone writes down "keep MER under 5" in a document where a colleague reads MER as a percentage, you have an instruction to run at a twentyfold return that reads as an instruction to run at a fifth of revenue. Pick one convention, write it in the same document as the target, and state the direction out loud every time you set one.
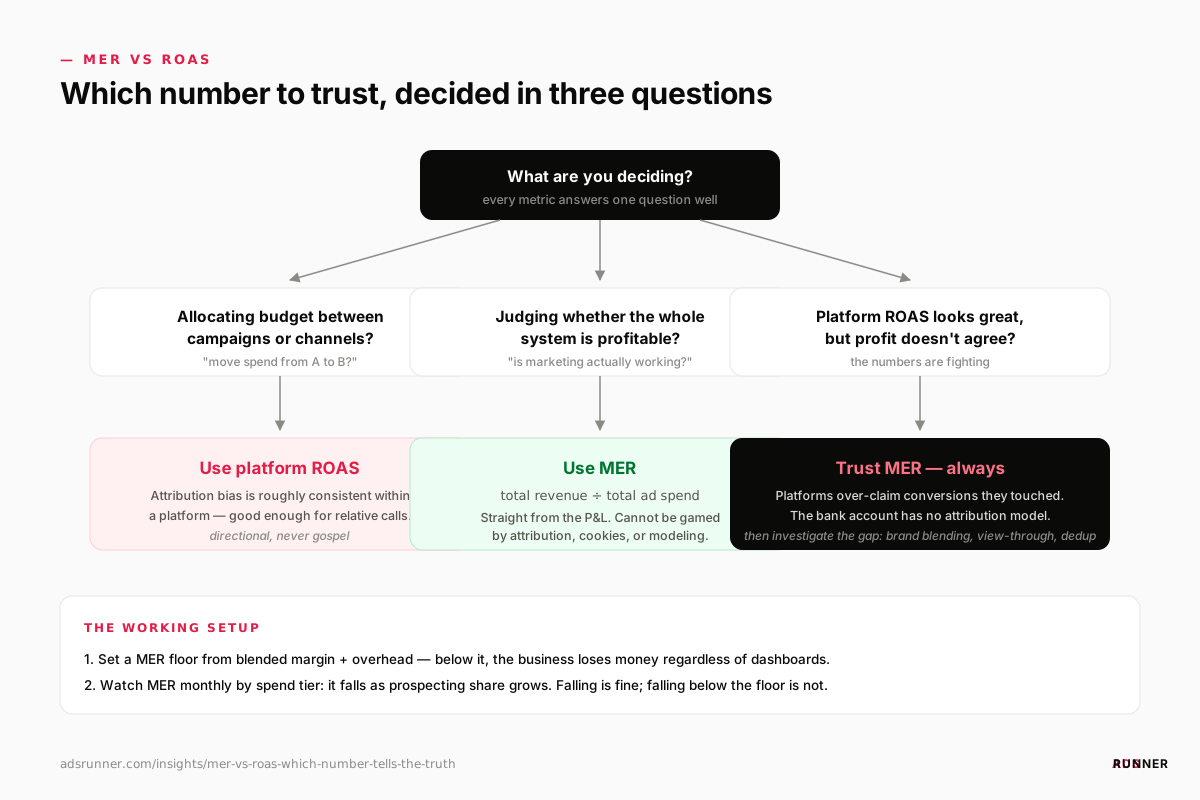
Embed this infographic on your site
<a href="https://www.adsrunner.com/insights/mer-vs-roas-which-number-tells-the-truth"><img src="https://www.adsrunner.com/infographics/mer-vs-roas-decision-tree.svg" alt="Decision tree for MER vs ROAS: use platform ROAS when allocating budget between campaigns inside one platform; use MER, total ad spend divided by total revenue as a percentage where lower is better, when judging whether the whole system is profitable; when the two disagree, trust the figure anchored to real transactions." width="1200" style="max-width:100%;height:auto;" /></a>
<p>Infographic by <a href="https://www.adsrunner.com/insights/mer-vs-roas-which-number-tells-the-truth">ADSRUNNER</a></p>
Free to use with the attribution link intact. A PNG version is available at the same path with a .png extension.
Your revenue sources rank, and the ranking is not a tie
A brand running Google, Meta, GA4 and a Shopify store has at least four revenue figures available for any given week, and they will not agree. The instinct is to treat that as a data quality problem to be fixed. It is not a bug. They are independent measurement systems reading different signals: server-side ad-click attribution on one side, client-side browser events on another, settled transactions on a third. Expecting them to converge misunderstands what each is counting. What they do have is an order of trustworthiness:
- Commerce ground truth: Shopify, Stripe, WooCommerce. Real transactions, real order IDs, real currency, net of refunds and cancellations. The highest-fidelity number you own, and the only one with no attribution model inside it at all.
- Verified first-party attribution: your own tracking, credited to touchpoints under a chosen model, but only once it has been reconciled against commerce truth on both match rate and value parity. Unverified first-party attribution belongs a rung lower than this; the verification is what earns the position, not the fact that the data is yours.
- GA4: third-party-instrumented analytics revenue, subject to GA4’s own session-based attribution, to consent and ad-blocker suppression, and to retroactive restatement for weeks after a day closes.
- Platform-reported conversion value: each ad network’s self-attributed number. Lowest fidelity, for a structural reason rather than a cynical one: every network counts a conversion it believes its own click or view influenced, using its own window and its own cross-device modeling, so two networks can both legitimately claim the same sale. Summing this across platforms does not approximate your revenue. It overstates it by construction.
Two rules fall out of that ladder, and they are the ones we hold ourselves to in the platform we build. Never blend sources into a single figure. If you need two, show them side by side with the source named on each. And never let a source silently substitute for another when the configured one has no data for the window: say the source is missing and name the gap. A revenue number that quietly changed its own definition mid-report is worse than a blank, because it looks continuous while the meaning underneath it moved.
One week, four numbers, three different Mondays
Here is the arithmetic that makes this concrete. The figures below are a constructed example with round numbers, not a client’s account, and the divergences are set at the modest end of what is ordinary. Run the same shape against your own last full week.
AD SPEND (one week)
  Google Ads                  18,000
  Meta                        22,000
  Total spend                 40,000

REVENUE FOR THE SAME WEEK, BY SOURCE
  Google Ads reported         96,000
  Meta reported               84,000
  Sum of platform-reported   180,000   <- do not do this
  GA4 purchase revenue       132,000
  Shopify net orders         148,000   <- commerce truth

DERIVED
  source              MER      blended ROAS
  platform sum       22.2%         4.50x
  GA4                30.3%         3.30x
  Shopify            27.0%         3.70x

OVERLAP AND SHORTFALL
  platform sum - commerce   +32,000   (+21.6% claimed twice)
  GA4 - commerce            -16,000   (-10.8% never seen)
Notice that the two wrong numbers are wrong in opposite directions. The platforms overstate, which is the failure everyone knows about. GA4 understates, which is the one that gets missed: a purchase event that never fires because of consent denial, an ad blocker, or a dropped client-side beacon is revenue GA4 simply never sees, even though the money arrived. "Platforms lie, so use GA4" trades a number that is too high for a number that is too low and calls it rigor.
Now apply a decision. Say this business breaks even at a 32% MER and targets 24% (the next section derives both from a P&L). On the platform figures it is running at 22.2%, comfortably inside target, and the correct move is to scale. On GA4 it is at 30.3%, within two points of breakeven, and the correct move is an emergency tightening. On commerce truth it is at 27.0% (genuinely profitable, five points of headroom, three points off target), and the correct move is to hold spend flat and go find efficiency. Same week. Same business. Same spend. Three incompatible Mondays, decided entirely by a choice nobody in the room remembers making.
The cheapest diagnostic in performance marketing: add up what your platforms claim they earned last month and compare it to what your store says you actually sold. If the first number is larger, the difference is the size of the fiction you have been managing to. Many teams have never run this subtraction.
Set the floor from your own P&L, not from a benchmark
Every "good MER for ecommerce" figure you will find online is someone else’s cost structure. The floor is not a benchmark, it is arithmetic, and it comes out of your contribution margin. Everything above the ad-spend line, stated as a share of revenue:
per 100 of revenue
  revenue                     100.00
  - cost of goods              54.00
  = gross margin               46.00
  - payment processing          2.20
  - shipping and fulfillment     8.80
  - returns provision           3.00
  = contribution before ads    32.00

BREAKEVEN MER          32.0%   (3.13x blended ROAS)
MER CEILING at 8 points
of contribution after ads
                       24.0%   (4.17x blended ROAS)
Breakeven MER is simply your contribution margin before advertising. Spend that share of revenue on ads and the last dollar of contribution goes to the platforms; spend less and the difference is yours. That relationship is why the percentage convention is the useful one. It sits on the same axis as every other line on the P&L, so the ceiling is a subtraction rather than a conversion. If you want eight points of contribution left after advertising, your ceiling is thirty-two minus eight.
| Contribution before ads | Breakeven MER | Breakeven blended ROAS | Ceiling MER | Ceiling blended ROAS |
|---|---|---|---|---|
| 25% | 25% | 4.00x | 17% | 5.88x |
| 32% | 32% | 3.13x | 24% | 4.17x |
| 40% | 40% | 2.50x | 32% | 3.13x |
| 50% | 50% | 2.00x | 42% | 2.38x |
Read the table in both directions and the convention problem disappears. A brand with a 25% contribution margin needs almost 6x blended ROAS to keep eight points, while a brand at 50% keeps the same eight points at under 2.4x. The same ROAS target is generous for one and ruinous for the other, which is why a target copied from another business is not a target. The breakeven ROAS calculator does the same arithmetic for your own margin.
Decision rule: if commerce-truth MER sits above the ceiling for two consecutive settled weeks, cut or reallocate before scaling anything. If it sits below the ceiling with room to spare, the business can afford to test more spend, and marginal returns decide how far.
Two extensions of that arithmetic are worth having. Ecommerce unit economics works through how repeat purchase behavior changes what you can afford to pay on a first order. Profit on ad spend takes the same logic down to campaign level, bidding to margin rather than revenue.
One structural warning about the floor. It is a blended average across your whole catalog, and a catalog is rarely uniform. A business with a 60% margin hero product and a 20% margin accessory range has one breakeven MER on paper and two completely different economics underneath it. If your product mix shifts (a promotion pushes volume into the low-margin range, say), the blended floor moves under you without any ad metric changing at all.
The number you read this morning is provisional
If your governing revenue source is GA4, there is a timing problem on top of the coverage problem, and it is the one that produces the most false alarms. GA4 metrics for a given day are not final at day close, and not final 48 hours later either. Late-arriving purchase events get folded back into the day they actually happened. Conversions get re-attributed to earlier sessions as more signal arrives. GA4 periodically revises its own channel classification retroactively, which moves credit between channels for days that already looked settled.
The practical consequence is that yesterday’s revenue figure is a lower bound rather than a measurement, and so is last week’s until enough time has passed. We handle this in our own pipeline by re-pulling a trailing thirty-day window of revenue-bearing data on every daily sync rather than treating a synced day as finished, plus a deeper weekly sweep at thirty-five days for the grains most exposed to reclassification. That is a lot of machinery to compensate for one property of the source, which is itself the argument for sitting on commerce truth where you can: a settled order does not restate.
Do not read week-over-week movement inside the restatement window as performance. If this week’s MER looks better than last week’s and last week’s figure has moved since you first saw it, some or all of the improvement is the source correcting itself. Teams reorganize campaigns over this.
What changed in 2026
Two platform changes affect the lower rungs of the ladder, and both make the case for governing on commerce truth stronger.
- Google Analytics now calls its conversions key events, to align with how Google Ads defines a conversion. A GA4 key event and a Google Ads conversion are not automatically the same count, so check which one a report is showing before comparing it with anything.
- Google Ads no longer supports the first click, linear, time decay, and position-based attribution models. Conversion actions that used them moved to data-driven attribution, with last click still available. Platform-reported revenue in Google Ads is therefore increasingly a modeled figure, which is exactly why it sits on the bottom rung.
- Google Ads can report gross profit when you send conversions with cart data and supply cost of goods in Merchant Center. That improves the platform view for campaign decisions inside Google. It does not make platform revenue additive across networks.
The decision rules
- Name one governing revenue source per business and write it down where the targets live. Highest available rung on the ladder, chosen deliberately, changed only on purpose.
- State the MER convention next to every target you set. Percentage, lower better, is ours; the multiple is fine as long as it is never both.
- Govern with blended MER against a floor derived from your own contribution margin. Never against a published benchmark.
- Use per-platform ROAS to move budget between campaigns inside one platform, where the attribution bias is at least consistent across the things you are comparing.
- Never use per-platform ROAS to compare one platform against another, and never sum reported revenue across platforms. Different windows, different view-through rules, same sales counted twice.
- When platform ROAS holds steady but blended MER drifts worse, treat it as the signal that your channels are increasingly claiming the same demand rather than creating new demand. That specific divergence is the earliest warning you get.
- Before reacting to a MER change, check whether the window is still restating and whether product mix moved. Both produce metric movement with no marketing cause.
Where this advice stops working
MER governs; it does not diagnose. It is a thermostat, and a thermostat cannot tell you which window is open. When blended efficiency degrades, MER will not tell you which channel caused it, because the whole point of the number is that it refuses to apportion credit. Answering "which channel" honestly requires a hold-out test rather than a better dashboard, which is the subject of incrementality testing without a data team.
- MER moves for reasons that have nothing to do with advertising: promotions, price changes, product mix, seasonality, a strong email month, an organic ranking win. A MER improvement can be an email team’s achievement, and it will show up in the marketing number regardless.
- Commerce truth is the highest-fidelity revenue figure and the least informative about cause. It tells you the total with total confidence and the reason with none.
- Brand demand contaminates every blended figure here. Ads absorb credit for customers who were going to buy anyway, which flatters efficiency at exactly the moment you are deciding whether to scale. That is a separate correction, worked through in brand vs non-brand: the measurement error.
- In our judgment, below roughly ten to fifteen thousand dollars a month in spend, the gap between platform-reported and commerce revenue is often smaller than the week-to-week noise, and building reconciliation machinery is premature. Read the store, spend the time on offer and creative instead.
- The example divergences in this article are illustrative arithmetic, not benchmarks. The direction of the errors is reliable: platforms over, GA4 under. The magnitudes are yours to measure, and we would not trust anyone quoting you a constant.
What to do this week
- Pull last full month: total ad spend, each platform’s reported revenue, GA4 revenue, and store revenue. Four numbers, one window.
- Subtract store revenue from the platform sum. That difference is your double-count, and its size tells you how much of your reporting has been fiction.
- Derive your contribution margin per hundred of revenue and set the breakeven MER and the ceiling from it. Two numbers, on paper, dated.
- Write the governing source and the convention at the top of the same document as the targets, and make it the thing anyone gets corrected against.
In our experience, the change that reliably alters the conversation is not the switch from ROAS to MER. Teams do that and keep arguing. It is the moment someone writes down which revenue number counts and everyone loses the ability to shop for a friendlier one. The metric was never the disagreement. The unnamed denominator was. Once it is named, the MER floor becomes the constraint every growth decision is checked against, which is how it fits into how to scale an ecommerce business.
What is MER in marketing?
MER, or marketing efficiency ratio, is total ad spend divided by total revenue across all channels, expressed as a percentage where lower is better. A MER of 25 percent means a quarter of revenue goes to advertising. Be careful with the unit: MER also circulates as a revenue-over-spend multiple where higher is better, and 25 percent is the same thing as 4.0x. State which convention you mean whenever you set a target.
What is the difference between MER and ROAS?
Blended ROAS and MER are the same economics inverted (revenue over spend versus spend over revenue), so neither is inherently more trustworthy. The real distinction is between blended figures, which use your total revenue, and per-platform ROAS, which uses the revenue one ad network claims credit for. Per-platform ROAS is useful for moving budget between campaigns inside that platform and misleading when compared across platforms, because each network counts sales the others also count.
What is a good MER for ecommerce?
There is no useful benchmark, because the answer is your own contribution margin. Breakeven MER equals everything left per unit of revenue after cost of goods, payment processing, fulfillment and returns, so a business with 32 percent contribution before ads breaks even at a 32 percent MER, roughly 3.1x blended ROAS. Subtract the profit contribution you want to keep to get your ceiling. Adopting someone else’s number imports their cost structure into your decisions.
Why is my ROAS high but my business unprofitable?
Three causes, usually together. Platforms each claim credit for overlapping orders, so summed reported revenue exceeds real revenue. Brand demand inflates reported efficiency because ads absorb credit for customers who would have bought anyway. And the ROAS target was set against revenue rather than contribution margin, so it was never a profitability threshold in the first place. Compare your platforms total against your store total and derive the floor from your P&L before changing anything in an ad account.
Should I use GA4 revenue or Shopify revenue for MER?
Shopify, or whichever commerce platform settles your transactions. It counts real orders net of refunds with no attribution model inside it, and it does not restate itself after the fact. GA4 sits a rung lower because purchase events can be suppressed by consent denial and ad blockers, and because GA4 keeps revising figures for weeks after a day closes. Use GA4 for the questions commerce data cannot answer, such as traffic source and on-site behavior, rather than as the governing revenue number.
Can I just add up the revenue each platform reports?
No, and this is the most common measurement error in ecommerce reporting. Each ad network counts a conversion it believes its own click or view influenced, using its own attribution window and cross-device modeling, so a single sale can be legitimately claimed by two or three platforms at once. Summing those figures overstates revenue by construction rather than by accident. If you need platform-reported numbers alongside your real revenue, show them side by side with the source labeled on each, never added together.
Written by Sam Nouri, founder, adsrunner. If this resonated and you want to apply it to your own account, you can book a strategy call or run a free audit.
How we research, source figures, and handle corrections: editorial policy.