Ecommerce unit economics: four numbers, one quantity.
CAC, LTV, payback, and MER get owned by different people, reported in different meetings, and quietly contradict each other. They are four questions about the same pool of money, and once you see that, the arithmetic stops being negotiable.
What changed in this revision: Added a short answer, a payback table that ties the maximum new-customer CAC to each rung of the revenue ladder, Google and Shopify sources, and dollar figures throughout.
When an ecommerce brand stalls, everyone looks at the ad account. Often the account is the crime scene, not the criminal. The actual failure happened earlier, in the unit economics: a CAC computed on the wrong denominator, an LTV inflated by revenue instead of margin, a bidding target that was never derived from either. Paid media executes the math you give it. If the math is wrong, excellent execution just gets you to the wrong place faster.
The deeper problem is that these get treated as four separate metrics, usually owned by different people. Finance owns margin, growth owns CAC, the founder owns LTV, and somebody produces a MER number monthly because a board deck asks for one. They then disagree, and the disagreement gets resolved socially rather than arithmetically. They should not be able to disagree. CAC, LTV, payback, and MER are four questions about a single quantity, the contribution margin one customer produces, and every one of them is answerable from the same waterfall.
- Contribution margin: how much money a customer actually leaves behind after the costs of serving them. Everything else on this list is a question about this number.
- CAC: what you paid to acquire the customer who produces it.
- LTV: how much of it arrives, and over how long.
- Payback: when enough of it has arrived to cover what you paid.
- MER: what share of the whole pool you are handing to the platforms.
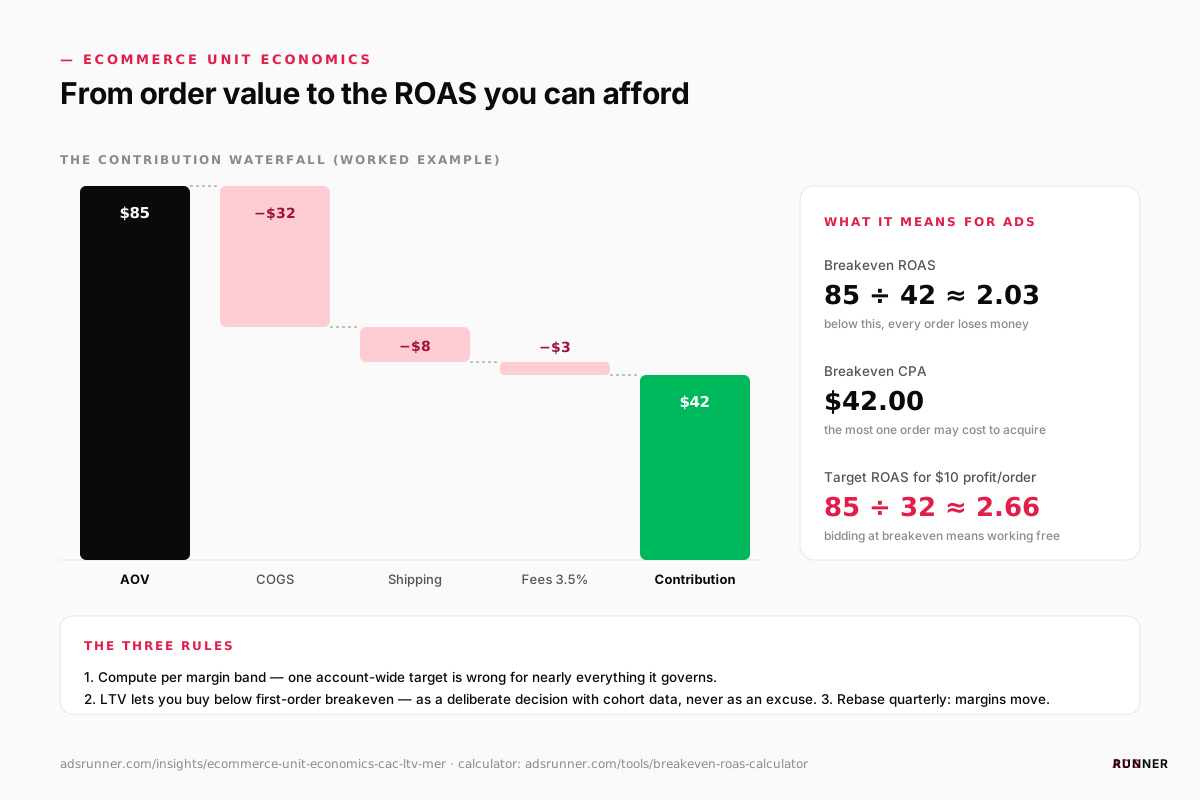
Embed this infographic on your site
<a href="https://www.adsrunner.com/insights/ecommerce-unit-economics-cac-ltv-mer"><img src="https://www.adsrunner.com/infographics/ecommerce-unit-economics-map.svg" alt="Ecommerce unit economics waterfall: an $85 average order value minus $32 COGS, $8 shipping, and $3 fees leaves $42 contribution margin, implying a breakeven ROAS of about 2.03, a breakeven CPA of $42, and a target ROAS of about 2.66 for $10 profit per order." width="1200" style="max-width:100%;height:auto;" /></a>
<p>Infographic by <a href="https://www.adsrunner.com/insights/ecommerce-unit-economics-cac-ltv-mer">ADSRUNNER</a></p>
Free to use with the attribution link intact. A PNG version is available at the same path with a .png extension.
Start with the waterfall, because everything derives from it
Take the order economics above and write them out per order. This is the entire foundation, and it takes four lines:
PER ORDER
  average order value          85.00
  - cost of goods              32.00
  - shipping and fulfillment     8.00
  - payment fees                3.00
  = contribution margin        42.00   (49.4% of AOV)

WHAT THAT IMPLIES IMMEDIATELY
  breakeven CPA                42.00
  breakeven ROAS                2.02x
  target ROAS for 10 profit     2.66x  (allowable CAC 32.00)
  breakeven MER                 49.4%
  MER ceiling at 10 points
  of contribution after ads     39.4%
Every number in the second block is the first block rearranged. There is no additional information and no judgment in the derivation. That is why a team that has genuinely agreed on the first four lines cannot then hold four incompatible opinions about targets. Many teams have never written the first block down, so they argue about the second one forever. The cheapest place to start is the cost per item field on every product in Shopify, which lets the store report margin itself instead of leaving it in a spreadsheet nobody updates.
CAC: the denominator problem
Customer acquisition cost sounds simple, spend divided by customers, and is quietly ruined by both terms. The numerator should be fully loaded: platform spend plus agency or team cost plus creative production. The denominator should be new customers only. Blending returning customers into the denominator is a common flattery, and it does not shade the number, it transforms it:
ONE MONTH
  fully-loaded marketing spend   28,000
  total orders                    1,000
  of which new customers            400
  of which repeat                   600

CAC, TWO WAYS
  spend / all orders              28.00   <- looks 14.00 inside breakeven
  spend / new customers           70.00   <- actually 28.00 over breakeven

  breakeven CPA (from waterfall)  42.00
The same month reads as comfortably profitable acquisition or as losing $28 on every new customer, depending entirely on a denominator choice nobody discussed. And the error is self-reinforcing: as repeat share grows, which is what success looks like, the blended figure improves automatically while genuine acquisition efficiency can be deteriorating underneath it. A brand can watch its CAC "improve" for three consecutive quarters while the cost of acquiring a stranger doubles. What a new customer really costs goes further on getting the new-customer count right.
This broken number is invisible from inside an ad platform, because the platform does not know which of your customers had bought before unless you tell it. New-customer goals, such as the customer acquisition settings in Google Ads, and a properly maintained customer list exist precisely so campaigns can distinguish acquisition from re-engagement. Use them, and mirror the split in your reporting so the two cannot drift apart.
LTV: margin or it is fiction
Lifetime value computed on revenue is a fiction that flatters. The only LTV that can justify an acquisition cost is contribution margin: revenue minus product cost, shipping, payment fees, and returns, accumulated per cohort over time. Two further disciplines keep it honest. First, use realized cohort curves, what the 6- and 12-month value of past cohorts actually was, rather than projections from your best year. Shopify's customer cohort analysis, which groups customers by the month of their first order, is a reasonable place to start. Second, segment: LTV by first product purchased and by acquisition channel can vary widely, which means a single blended LTV target can be wrong for every campaign you run.
The question that catches most broken models: if you acquired a customer today at your current CAC, in which month does the cohort curve say you get the money back? If the answer makes the room uncomfortable, the bidding targets are guesses.
Payback window: the cash constraint
LTV justifies CAC eventually; cash flow decides whether you survive until eventually. This is the part that reads as accounting pedantry right up until it is the only thing that matters, so here is the arithmetic that shows a business with a respectable ratio walking into a wall. Take the $70 real CAC above and a cohort that pays back over six months:
ONE COHORT OF 400 CUSTOMERS, CAC 70.00
  cash out at acquisition        28,000
  contribution returned:
    month 0 (first order)        16,800   (42.00 each)
    by month 3 cumulative        24,400
    by month 6 cumulative        31,200   <- payback here
    by month 12 cumulative       41,600

  LTV-to-CAC at 12 months          1.49x
  working capital held per
  customer until payback           28.00

NOW SCALE IT
  acquiring 400/month, flat      -11,200 per month of new float
  growing new customers 20%/mo    float compounds with the ramp
  six cohorts in flight at once   all pre-payback simultaneously
Every cohort is cash-positive by month six and the business is still starving, because at any moment six cohorts are in flight and only the oldest has paid for itself. Growth makes it worse rather than better: each month’s larger cohort demands more float than the one recovering. This is how brands die at ratios their board deck describes as healthy. Not because the unit economics were wrong, but because nobody separated the question "is this profitable" from the question "can we fund it."
So set an explicit payback ceiling that matches your balance sheet rather than your ambition. Bootstrapped brands often need first-order or three-month payback and should bid as if later revenue does not exist. Funded brands can stretch, and the stretch is a real strategic advantage: it lets them outbid you for the same customer while both of you are being rational. Let that ceiling, not the LTV ratio alone, cap how aggressively you bid. The CAC payback calculator runs the same arithmetic on your own numbers.
The payback rule for each rung of the revenue ladder
The waterfall and the payback cohort combine into one decision rule: the most you can pay for a new customer depends on how long you can wait to be paid back. Using the worked cohort above, here is that rule as arithmetic, next to the rung of the revenue ladder where each window is a sensible starting default.
| Payback window | Cumulative contribution per customer | Max CAC that pays back in the window | Does the $70 CAC fit? | Rung where this window is a sensible default |
|---|---|---|---|---|
| First order | $42 | $42 | No, $28 over | $250k to $1M a month, while cash is tight and returning revenue is small |
| 3 months | $61 | $61 | No, $9 over | $1M to $2M a month, once the new-customer engine is funded on purpose |
| 6 months | $78 | $78 | Yes, $8 of headroom | $2M to $3M a month, when margin work has raised first-order contribution |
| 12 months | $104 | $104 | Yes, $34 of headroom | $3M a month and beyond, and only with a cash forecast that carries the float |
The rung column is a default, and your balance sheet overrides it in either direction. A funded brand at $600k a month may run a six-month window. A $4M brand with tight inventory financing may need three.
Two ladder consequences follow. First, climbing a rung changes the inputs, not just the window. Margin, offer, and AOV work raises first-order contribution, which lifts every row of the table at once: add $8 of contribution to the first order and the three-month ceiling rises from $61 to $69. Second, the float scales with the ramp. Doubling new customers per month from 400 to 800 doubles the cash in flight before payback, from $11,200 to $22,400 for each new cohort, which is why forecasting joins the scoreboard on the top rung.
The decision rule: set the payback window from your cash, read the maximum new-customer CAC off your own cohort curve at that window, and hold every channel to it. When the real CAC sits above the ceiling, the fix is a cheaper customer or a larger first order, not a longer window chosen to make the number fit.
MER: the blended guardrail
MER is total ad spend as a share of total revenue, a percentage where lower is better, so a 39% MER means 39 cents of every dollar goes to advertising. It also circulates as a revenue-over-spend multiple where higher is better, in which form 39% is about 2.56x; the two are the same fact read in opposite directions, and the only real hazard is setting a target without saying which convention you mean. We use the percentage because it composes with a P&L, where every other line is also a share of revenue.
Its role here is structural rather than merely additional. Note what happened with CAC: it had to be computed on new customers only, or it flattered. MER is the opposite: it must be computed across everything, new and repeat, because it is the number that asks what share of the total contribution pool the platforms are taking. Applying the same denominator philosophy to both is precisely the error. CAC narrows deliberately; MER refuses to narrow at all, which is what makes it impossible to game by attribution.
And because contribution margin is roughly constant per order, breakeven MER simply equals your contribution margin percentage, 49.4% in the worked example. Spend that share of revenue on advertising and the last cent of contribution goes to the platforms. Subtract the contribution you intend to keep to get the ceiling. The mechanics of choosing which revenue figure feeds it, and why platform-reported revenue will inflate it, are in MER vs ROAS. Expect MER to worsen as you scale and prospecting share grows: that is arithmetic, not failure. Crossing the floor is failure.
Turning the numbers into targets
- Compute contribution margin per order band, and set campaign-level ROAS targets from margin, not from habit. A 30%-margin catalog needs roughly 3.3x just to break even on the first order. The free breakeven ROAS calculator does this per margin band in seconds.
- Decide how much future-cohort value you are licensed to spend against (your payback ceiling answers this), and adjust acquisition targets accordingly.
- Give every campaign a target derived from the margin and repeat behavior of what it sells. Target ROAS bidding in Google Ads optimizes toward whatever value-to-spend ratio you set, so one blended account-wide target is a spreadsheet error the bidding system then executes faithfully every day.
- Revisit quarterly with finance in the room. Margins move, shipping moves, product mix moves; targets that do not move with them rot silently.
Where this model stops being reliable
- A blended waterfall hides a mixed catalog. One contribution margin across a 60%-margin hero product and a 20%-margin accessory range describes neither. If a promotion shifts volume between them, your breakeven moves without a single ad metric changing. Build the waterfall per margin band before you trust a single account-wide target.
- Realized cohort curves are backward-looking by construction. They are still the honest input, but a brand whose product, price or customer mix changed a year ago is forecasting from a business it no longer runs. Re-cut the curves whenever something structural moves, and distrust any curve built on a single exceptional cohort.
- Returns provisions are often guessed and often wrong. In categories with high return rates the provision is one of the largest lines in the waterfall and the least carefully estimated. If you have never reconciled provisioned returns against actual, that line is decorative and so is your breakeven.
- LTV cannot license spend your bank cannot fund. The payback ceiling is a hard constraint and the LTV ratio is a soft one. When they conflict, the ceiling wins every time, and treating a strong ratio as permission is exactly the failure worked through above.
- None of this identifies the constraint on growth. Sound unit economics tell you whether to scale, not what is stopping you. If the binding constraint is creative, or supply, or the site, better arithmetic will not move it. How to scale an ecommerce business covers the diagnosis that comes first.
- Below roughly $10,000 a month in spend, this is more precision than the data supports. Monthly cohorts are too small to produce stable curves, and the honest version is a rough contribution margin and a first-order payback rule until volume makes the rest legible.
None of this is glamorous, and all of it is upstream of every scaling decision you will make this year. Get the numbers agreeing: honest CAC on new customers only, LTV on margin from realized cohorts, an explicit payback ceiling from the balance sheet, and a MER floor from the waterfall. Then the ad account becomes a machine for executing a strategy instead of a place to argue about one. The disagreements do not survive the arithmetic, which is the actual reason to do it. This math sits underneath our DTC growth practice, and for how these numbers behave once you push spend, see what changes past $100k a month.
How do you calculate ecommerce CAC correctly?
Fully-loaded cost divided by new customers only. The numerator should include platform spend plus agency or in-house team cost plus creative production; the denominator must exclude returning customers, because blending them in can make reported CAC look half its real size or less while the true cost of acquiring a stranger climbs unwatched. Use platform new-customer goals and maintained customer lists so campaigns can tell acquisition from re-engagement, and mirror that split in your reporting.
Should LTV be calculated on revenue or margin?
Margin, always. Revenue LTV is a fiction that flatters. The only lifetime value that can justify an acquisition cost is contribution margin: revenue minus product cost, shipping, payment fees, and returns, accumulated per cohort over time. Use realized cohort curves rather than projections from your best year, and segment the number, because LTV by first product purchased and by acquisition channel can vary widely, which means one blended LTV target can be wrong for every campaign you run.
What payback period should an ecommerce brand target?
Whatever your balance sheet can actually fund, set explicitly rather than implied. LTV justifies CAC eventually; cash flow decides whether you survive until eventually, and a brand with a healthy 3x LTV-to-CAC ratio and an 18-month payback can still die scaling because every cohort consumes cash it does not recover for a year and a half. Bootstrapped brands often need first-order or three-month payback; funded brands can stretch further. Let that ceiling, not the ratio alone, cap how aggressively you bid.
What ROAS target should I set from my margins?
Derive it from contribution margin per order band rather than habit: a catalog running 30 percent margin needs roughly 3.3x simply to break even on the first order, before any profit. Give every campaign a target derived from the margin and repeat behavior of what it sells rather than one blended account-wide target, and revisit quarterly with finance in the room, because margins, shipping costs, and product mix all move while static targets rot silently.
Can a business with a good LTV-to-CAC ratio still run out of cash?
Yes. The ratio tells you a cohort eventually pays for itself; it says nothing about when. If payback takes six months, then six cohorts are in flight at any moment and only the oldest has covered its own acquisition cost, so every month of growth demands more working capital than the recovering cohort releases. Set a payback ceiling from what your balance sheet can fund and treat it as the binding constraint, with the LTV ratio as secondary.
How is breakeven MER calculated?
Breakeven MER equals your contribution margin as a percentage of revenue, meaning everything left after cost of goods, shipping and fulfillment, payment fees, and returns. A business keeping 49 percent of order value after those costs breaks even at a 49 percent MER, which is roughly 2.0x in the revenue-over-spend convention. Subtract the contribution you intend to keep to get your operating ceiling. Note that MER is deliberately computed across all revenue including repeat orders, unlike CAC, which must use new customers only.
What payback window should I use at my revenue band?
The window is set by cash, not by revenue, so treat any band rule as a default. A sensible starting point is first-order payback between $250k and $1M a month while returning revenue is small, about three months once you are deliberately funding a new-customer engine at $1M to $2M, and six months or longer only when margin work and a cash forecast can carry the float. Then read the maximum new-customer CAC for that window off your own cohort curve and hold every channel to it.
Written by The ADSRUNNER team. If this resonated and you want to apply it to your own account, you can Take the growth check or run a free audit.
How we research, source figures, and handle corrections: editorial policy.
