Facebook Numbers and Trends Facebook Marketers Should Know For 2022
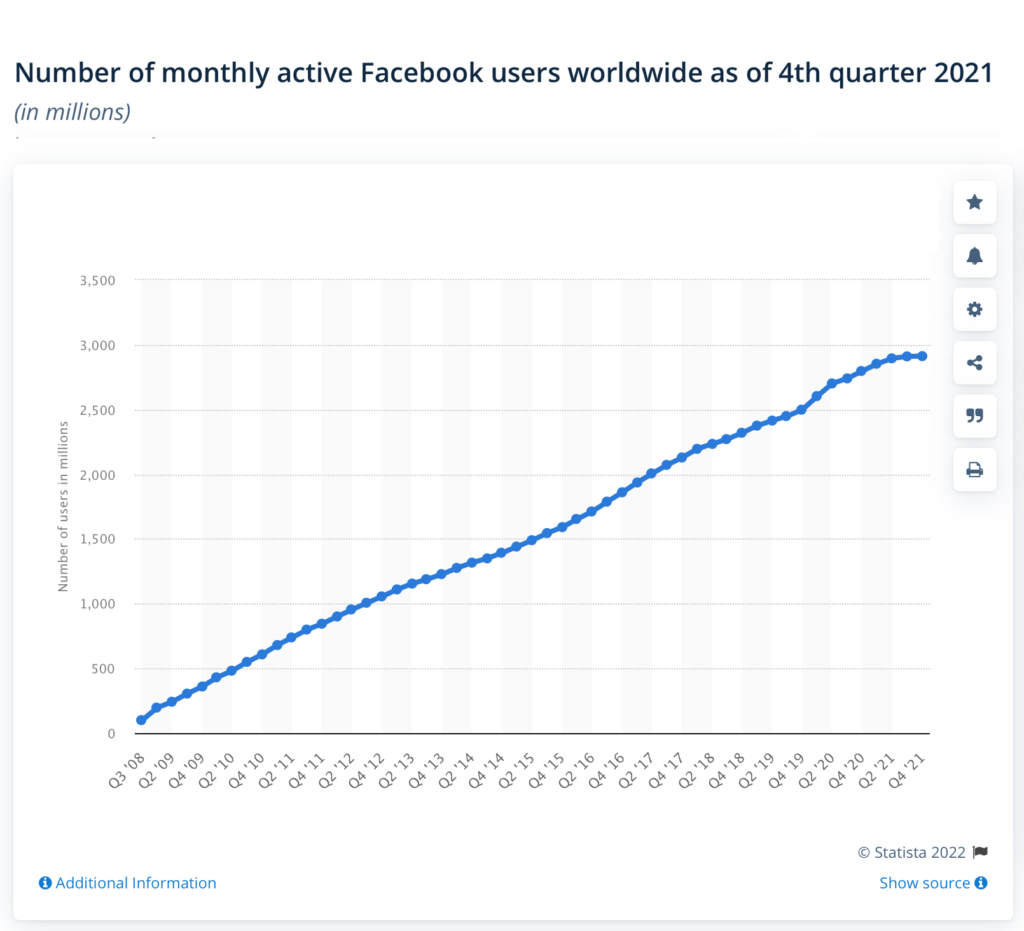
If you want one take away, this graph says it all… That’s it, move on…

Source: Statista 2022
Just kidding. Social media is constantly evolving, so marketers need to move with the trends to optimise marketing investment returns.
For instance, Facebook user numbers have consistently grown, but the more observant, or knowledgeable reader, however, will see the momentum dropping most recently in Statista’s graphic analysis. Let’s look at what’s behind these numbers to guide your Facebook marketing priorities through 2022.
Facebook remains the longest running and largest social media platform, popular with all age groups and continually growing active user numbers (i.e. those who have logged in in the past month). Check out Statista’s 2022 analysis since 2008, which shows that this market leader had nearly 3 billion users by the fourth quarter of 2021 (2.91b, say Statista; 2.8b claim Sprout Social; but let’s not get pernickety!) While some social networks are still hovering below 1 billion, Facebook hit that milestone ten years ago.
Facebook’s parent company, Meta, dominates social networking, with Facebook as the daddy of them all. Together with WhatsApp, Instagram and Messenger, 3.51 billion monthly users were hit in the first quarter of 2021. Facebook just cannot be ignored therefore, and constantly strives to remain the relevant market leader.
Who Still Hangs Out on Facebook?
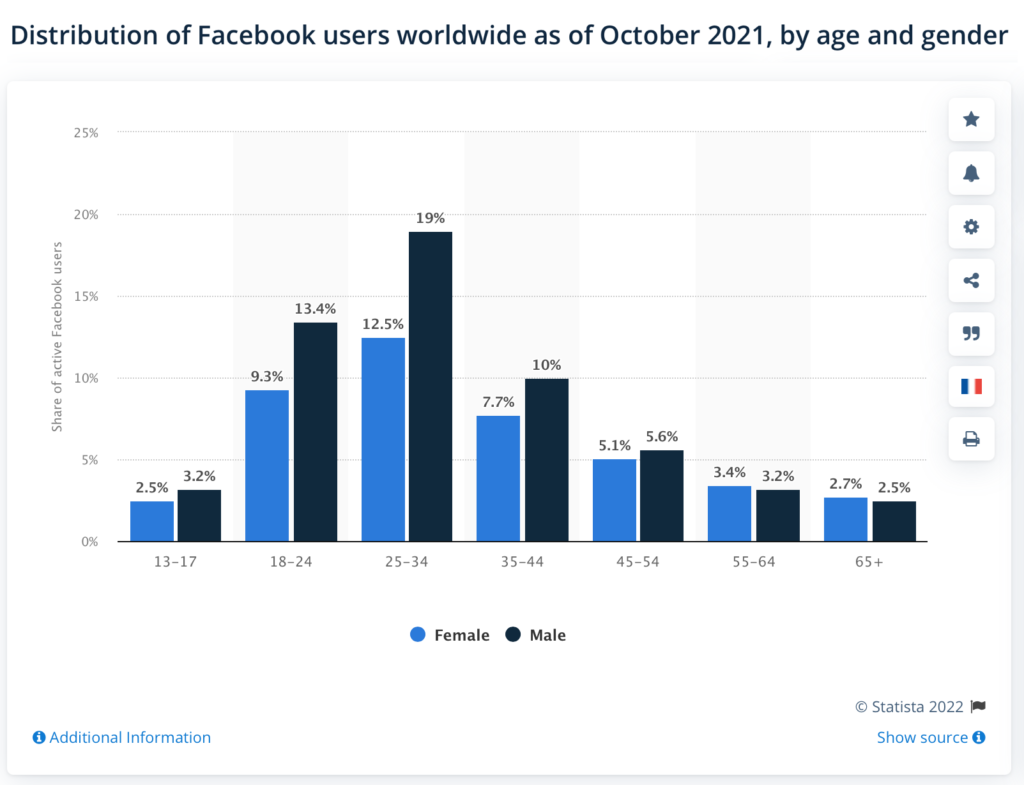
Well, most of us are on Facebook these days. Even employers like to view job candidates’ profiles, a final nudge into registering for some. All age groups use this platform nowadays, as younger family members help family members sign up. However, the core age groups remain 25-34 year olds. Men outstrip women by 7%, with 19% versus 12.5% of users respectively for this age range. 18-24 year olds are the next biggest grouping, with 13.4% being you men and 9.3% young women. Women only start to show greater numbers among 55’s and overs. For marketers, a key Sprout Social statistic pulled from Statista’s graphic representation of the distribution of Facebook users globally below, was that 72.8% of users range from ages 18–44.

Source: Statista 2022
Where Are People Hanging Out on Facebook?
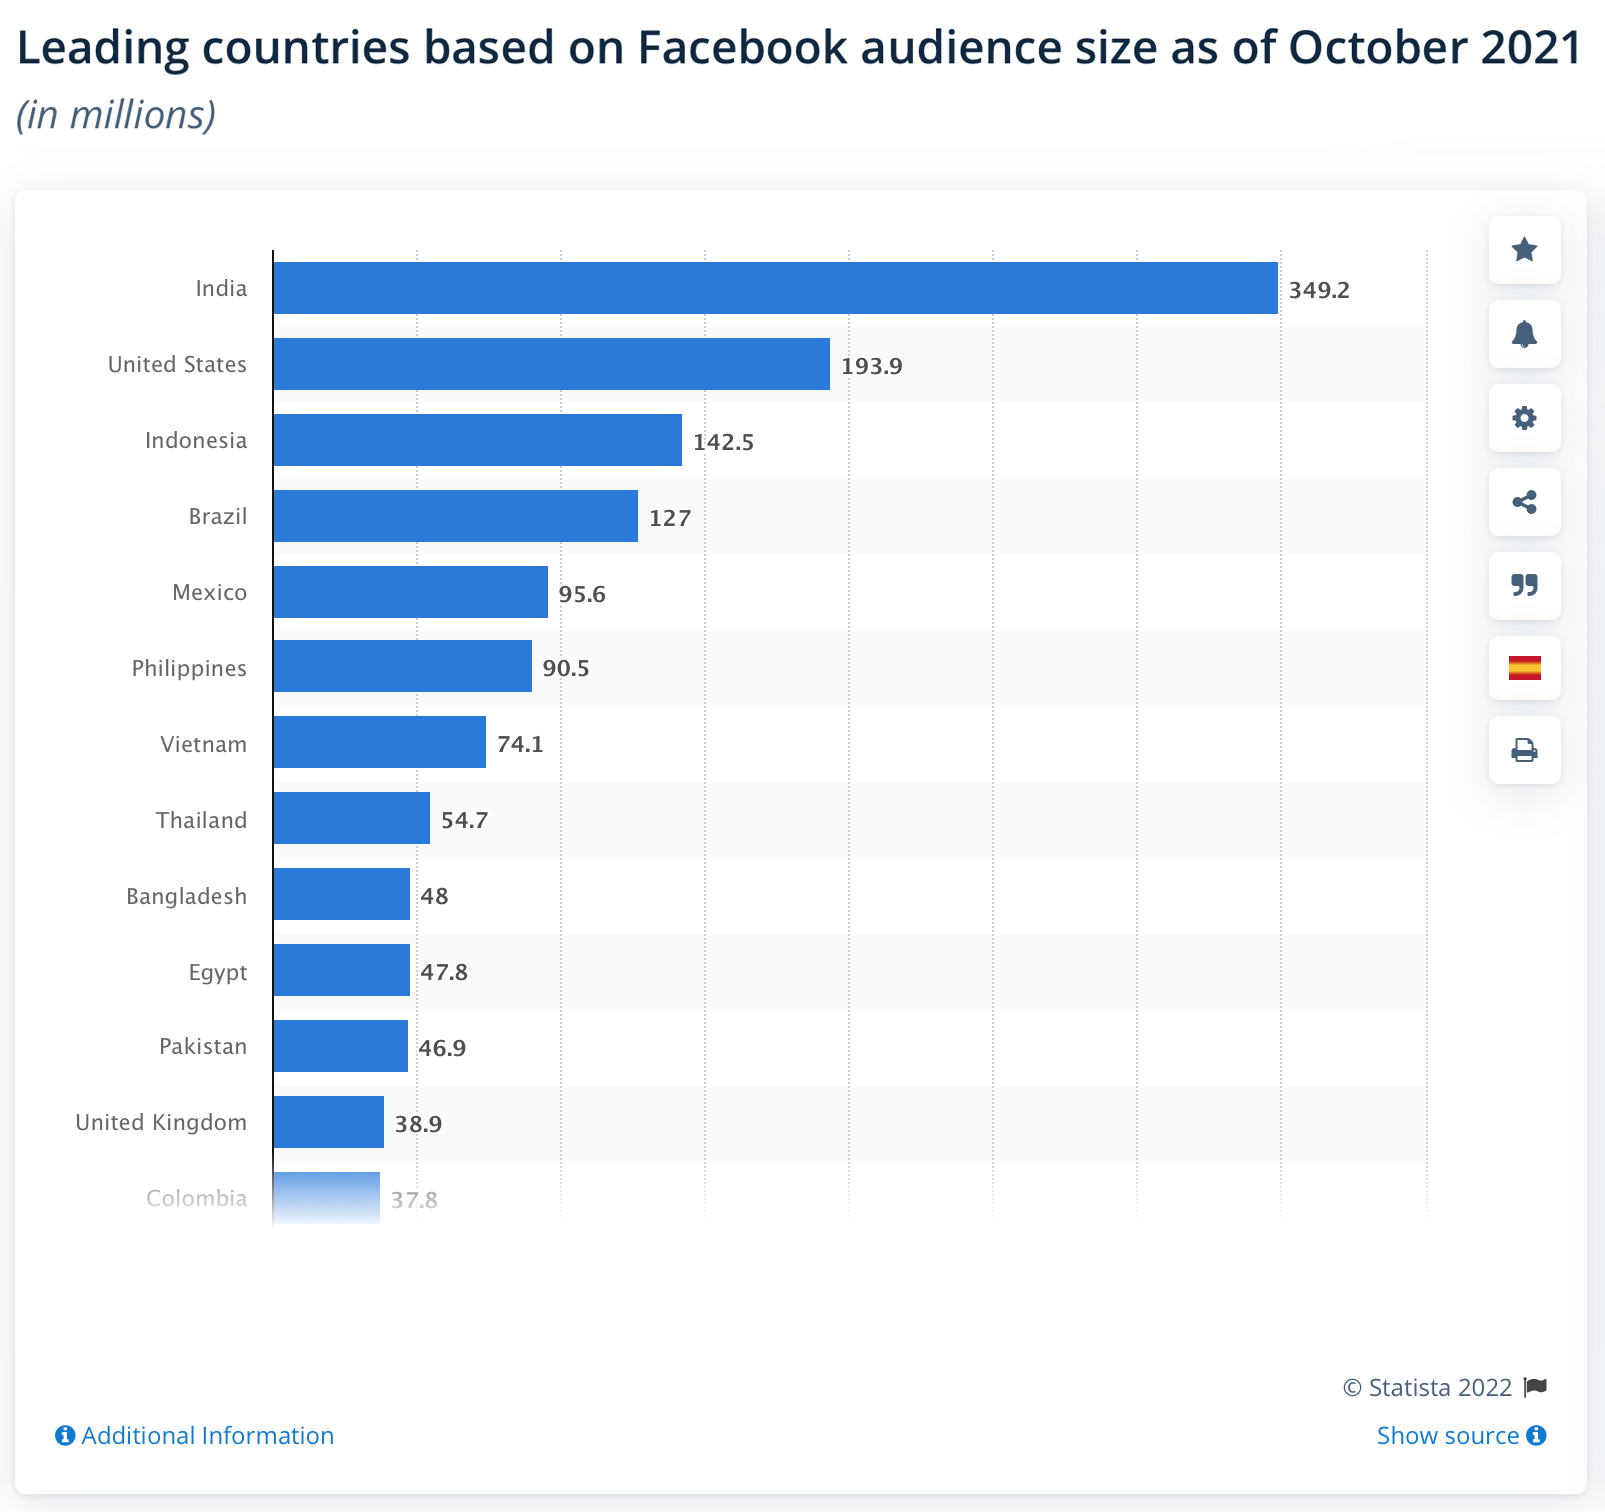
In October 2021, India led the world in terms numbers of people on Facebook, with 349.2 million users. The United States followed with 193.9 million users. Readers may be surprised to learn that Indonesia came third, with 142.5 million users at the end of last year.
The U.K. came in 12th at 38.9 million, i.e. over half of the population. From Europe, three countries are worthy of note, with France having a presence of 33.5 million people, Italy 31.1 million and Germany having 28 million showing up. Other key populations included some SE Asian and South American countries. In Africa, only Nigeria got a mention.
For a breakdown of the top ten countries using FB, check out Statista’s insightful graph here.

Source: Statista 2022
These statistics may surprise you, but out of context, it is a little difficult to tell what is going on exactly, which is why active analysis of ad performance and testing are so important. Also, it is interesting to see that some poorer populations may find Facebook an important media resource. Anyway, Statista’s findings, clearly show that this platform is pretty ubiquitous and Facebook advertising is an invaluable tool in your marketing toolkit.
For marketing to Americans, it is notable that Statista anticipates that user numbers will grow from “…228.6 million to 237.8 million by 2025”. They project 69.1% of Americans becoming Facebook users.
Who Hangs Out The Longest on Facebook?
Younger people may have less responsibilities and have grown up in a networked world, so maybe no surprises that they are more heavily represented on Facebook’s platform in terms of how long they spend there. Edison Research of American users showed that Facebook was their preferred social media site, confirmed by 32% of 12-34 year olds. While there is slippage from five years ago, this is possibly explained by more social platforms offering functionality enhancements to users.
Hence, competitors like Instagram, Snapchat and TikTok are grabbing more attention of younger online browsers, apparent in Edison’s graphic illustration of comparative users for 12 to 34 year olds.
Show Me The Money!
Stepping back from the younger demographic focus for a moment, it seems that a significant proportion of people earning over $100k per year, i.e. 4.86% of users among the 2.75 billion, plus – regardless of whose statistics you deem truest, this is an undeniably huge audience. Across all socio-economic groupings, however, levels of Facebook browsing are fairly even. Statista tells us that: “The lowest percentage is 81% of $60–$70k earners” and the highest is 88% of $30–$60k earners. If that does not whet your marketing appetite, nothing will. Rest assured that any Facebook advertising campaign can profitably target people with differing incomes and still maintain a high hit level.
For business minded readers, you may already be wondering if younger Facebook users have the kind of incomes that makes them a viable marketing campaign target.
Absolutely!
Even if young people are less able to afford their own homes in countries like the U.K. and U.S.A. these days, they still spend on other goods, be that cars, beauty products or services, health, fashion or gadgetry. Attracting younger customers via Facebook advertising, if done well, means you potentially are enticing lifelong buyers, brand loyalists and ambassadors i.e. free marketing in the viral social networking world.
What Are Users Doing These Days?
Knowing what users are doing when engaged on this platform is essential to maximising returns on Facebook marketing. Yes, of course, things aren’t much different from over the years, but subtle shifts are happening, as peoples’ perceptions and priorities change, as younger generations come online and countries experience greater economic growth.
Statista report some key marketing findings, like, unsurprisingly, mobile is increasingly the preferred route to social networks. So, take note for your Facebook marketing strategies that 98.3% of users accessed the site via mobile devices in 2021; a whopping 79.9% solely used a mobile.
This is why your Facebook Page demands much attention, when creating Facebook advertising campaigns. Posts and ads need to present well via mobile to maximise clicks. Remember, that 73% of Facebook users in the U.S. are checking in daily here; that goes up to 93% of users logging in weekly. Americans are generally the best understood in terms of Facebook habits, because of their colossal collective spending power. Every click counts in this discerning market.
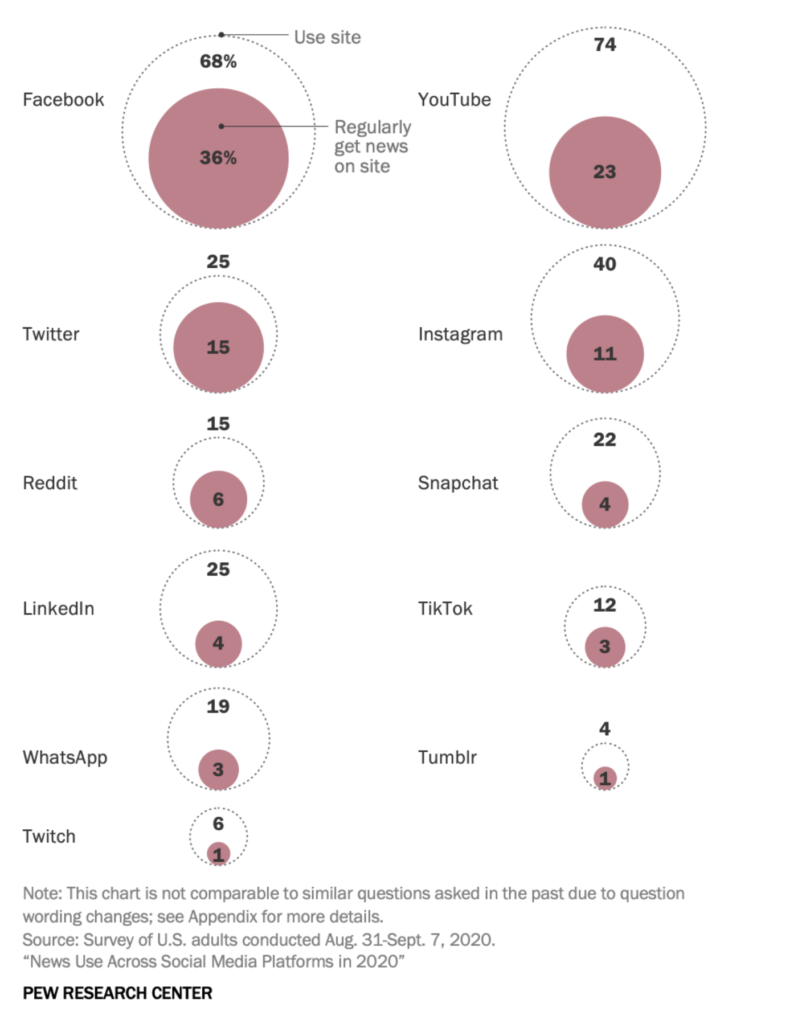
While many of us go to Facebook to check out what is happening among family and friends, as many as 36% of people in the U.S. also choose to read their news via Facebook. Journalism.org ‘s analysis of usage of social media for sources of news showed that 53% of Americans claim they do this “often” or “sometimes”; Facebook topped this sources list. Here’s how that picture looks:

There have been accusations of bias and unreliable news on Facebook over recent years, with corresponding falling user numbers, leading to improvements in fact checking on the site. This is a figure to watch for advertisers in 2022, albeit a huge readership remains, even if there is a sceptical 59%, who do not believe the news is accurate here. It is worth bearing these events in mind if you are looking to build your brand by sharing news items relevant to your products and services; monitoring engagement with such posts is essential, as is checking responses to posts which may damage your reputation.
In terms of other activities Facebook users like to do when on the site, Statista reported in 2019 that 65% of U.S. Facebook users tend to like viewing photos; this maybe shows, then, that there is a certain level of superficial engagement, so content posted is best kept light in tone, so users enjoy a break here after a tough day at work, or when family pressures get too much. It also seems from this figure, that users still view Facebook as a source of personal networking, which again points to an easier atmosphere being preferred among digital networks.
Among the various social networking sites available, Facebook ranked highest for content sharing, by users, with 57% telling researchers they liked to do this. This relatively low figure seems to suggest a significant element of passive consumption of content. It might also suggest from the previous photo viewing evidence, that Facebook is very much a leisure activity, with users desiring a relaxing experience for the most part.
Social Insider research confirms these engagement levels. Their 2020 study showed an average engagement rate of 0.27%, across business sectors. We conclude from this that Facebook advertisers should probably lean towards easy-going or fun posting tones.
What was striking from this research was that politics gets the highest post engagement rate, at 0.9%. We are all familiar with Facebook tussles over controversial issues. Unsurprisingly, these results happened in a US election year, but we can safely say this is a regular occurrence, but keep watching that space. There have been trends in posting of controversial content as click bait, but advertisers should treat such strategies as risky when building positive brand perceptions.
Timely Touch Points
Facebook’s own statistics here suggest that two thirds of users do actually visit a business page at least once a week. We can’t stress enough how ensuring your Facebook page and ads are formatted appropriately to accommodate most clickers accessing your page via their mobile; this is absolutely essential to your Facebook advertising success.
If you are wondering if there may be better times than others for reaching users, there is some evidence from Sprout Social that Tuesdays, Wednesdays and Fridays are worth split testing. For times of day, there seems to be heavy use from morning to midday. However, a caveat here is to pay to the business niche you’re working in, the demography and target countries, as well as the social media platform, as these may vary significantly based on your target audience.
Counting the Costs of Clicks
It’s encouraging to note that of the Meta family, Facebook dominates over Instagram, Messenger and Audience Network for preferred ad placement platform; 45.2% of ads are here versus Facebook’s sister sites. This is because click through rates are much higher than the other platforms, at 3.9%. Audience Network comes in second at 0.99%.
Status ads have the highest CTR, at 6.65% from the pool of over 250,000 ads analysed by Social Insider from across Europe, North and South America and Asia. However, it seems that advertisers prefer to invest their advertising budget into video and share. This could be an opportunity for making savings by allocating more of your ad spend here and comparing cost per acquisition (CPA) outcomes; conversions are your most crucial metric.
Across the Meta channels, Ads Manager shows a cost per impression at an average of $5.31 per thousand (CPM – remember, guys, that ‘M’ isn’t ‘million’. Apparently, cost per click (CPC) has remained around $0.43. Of course, since Social Insider posted these figures, there has been a pandemic, thus more captive audiences with increased browsing time, which means competition also has increased in the race to grab greater market share. For more up to date figures for your industry, it’s worth talking to Facebook Marketing specialists if you are weighing up relative costs between ad channels.
So Many Features, So Little Margin For Error
Decisions as to where to invest to maximise advertising revenues is a learning curve for any business and keeping abreast of the power of different Facebook features is a big deal for many advertisers. That’s unsurprising, we have not even looked at Facebook Groups or aspects of video here (the clue is maybe in how a mobile screen is comfortably handled!)
We hope that this Facebook statistics laden post has given you some insights that help you better prioritise your marketing spend on Facebook, but we recommend keeping your eye to the social media landscape, which is continually evolving. If you want to find out any specific figures in relation to Facebook advertising, drop us a message and we will get back to you.
- Written by: Sam Nouri
- Posted on: February 1, 2022
- Tags: Facebook Ads


