SaaS marketing metrics that matter.
Benchmarks moved and most target-setting did not. The numbers that should govern SaaS paid spend in 2026.
SaaS teams inherit their target metrics the way families inherit furniture — from an earlier era, without much inspection. The 12-month CAC payback "rule," the 3:1 LTV:CAC ratio, the benchmarks screenshotted from a 2021 board deck: all formed in a different market. The current benchmark data tells a different story, and paid media targets derived from the old story misallocate real money. Here is what the numbers look like now, and how to actually use them.
Embed this infographic on your site
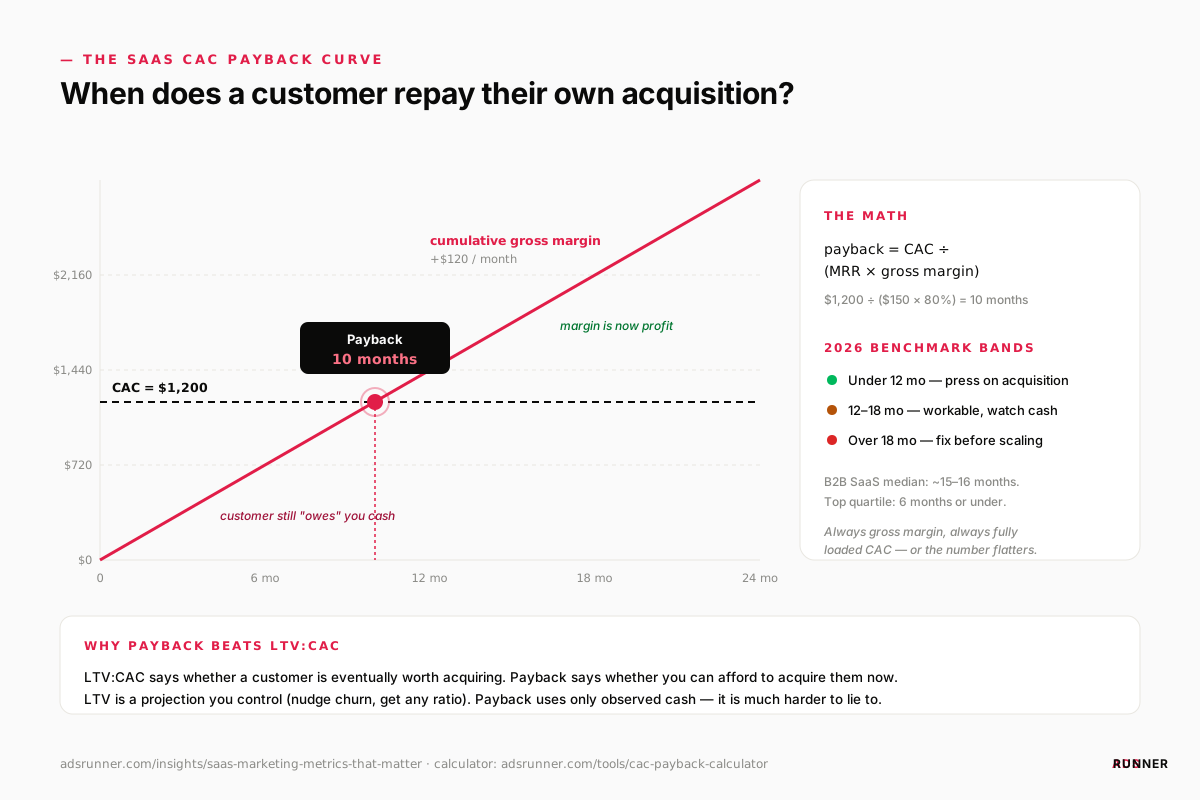
<a href="https://www.adsrunner.com/insights/saas-marketing-metrics-that-matter"><img src="https://www.adsrunner.com/infographics/saas-cac-payback-curve.svg" alt="SaaS CAC payback curve: cumulative gross margin of $120 per month crosses a $1,200 CAC at 10 months. Benchmark bands: under 12 months healthy, 12 to 18 months workable, over 18 months fix before scaling. B2B SaaS median is around 15 to 16 months." width="1200" style="max-width:100%;height:auto;" /></a>
<p>Infographic by <a href="https://www.adsrunner.com/insights/saas-marketing-metrics-that-matter">ADSRUNNER</a></p>
Free to use with the attribution link intact. A PNG version is available at the same path with a .png extension.
CAC payback: the metric that governs spend
CAC payback — months to recover fully-loaded sales and marketing cost per new customer, gross-margin adjusted — is the single most decision-relevant metric in SaaS acquisition, because it prices growth in cash. The current benchmark picture from the major 2025-2026 datasets (Benchmarkit, ChartMogul, and the large sales-ops samples): the B2B SaaS median sits around 15-16 months, improved from roughly 18 a year earlier, with top-quartile companies at 6 months or under. The old universal 12-month target now describes top-third performance, not the middle.
- SMB-focused SaaS (ACV under ~$15k): 8-12 months is healthy; under 7 is best-in-class. Short cycles and self-serve motions make faster payback both possible and necessary — churn is higher, so slow payback compounds badly.
- Mid-market ($15-100k ACV): 14-18 months is the healthy band. Above 20, the problem is usually funnel conversion efficiency, not top-of-funnel cost.
- Enterprise ($100k+ ACV): 18-24 months is normal; suspiciously fast payback here usually means under-loaded CAC (sales-engineer time left out) rather than brilliance.
- Investor shorthand across stages: under 12 reads as efficient, 18 raises questions, past 24 is a structural unit-economics conversation.
Compute it honestly or not at all: fully-loaded S&M (salaries, tools, agency fees, creative) divided by new ARR times gross margin. The revenue-unadjusted version flatters by 20-40% — enough to turn a real problem into a fake success. The free CAC payback calculator runs the gross-margin version, with LTV:CAC alongside.
LTV:CAC — useful, and easily gamed
The 3:1 LTV:CAC convention survives because it is directionally sound: below 3, acquisition returns too little; far above 5, you are probably under-investing in growth. Its weakness is that LTV is a projection you control — nudge the churn assumption and any ratio becomes achievable. Two disciplines keep it honest: compute LTV on gross margin (not revenue) using realized cohort retention (not aspiration), and treat the ratio as a portfolio check while CAC payback — which uses only observed cash — governs month-to-month spend decisions. When the two disagree, trust payback; it is harder to lie to.
The supporting cast
Three more metrics earn a place on the paid media dashboard. Pipeline velocity — opportunities times win rate times deal size over cycle length — because paid media can move all four inputs and a velocity view catches quality problems a CPL view hides. Cost per qualified opportunity, the bridge metric between marketing spend and revenue truth, the heart of the pipeline-not-leads argument. And net revenue retention, not because paid media controls it, but because it sets your license to spend: a 115%-NRR company can afford a payback period that would sink a 90%-NRR company, since each cohort grows after landing rather than shrinking.
From benchmarks to bidding targets
- Pick your payback ceiling from your segment band and cash position — say 15 months for a mid-market company with runway.
- Translate to allowable CAC: ceiling months times monthly gross-margin contribution per customer. That is the fully-loaded number.
- Back out the paid media share: subtract per-customer sales cost, then divide the remainder by your lead-to-customer rate to get a maximum cost per qualified lead the math can defend.
- Hand that number to the campaigns as the target — and revisit quarterly, because win rates, margins, and cycle lengths all drift, and a target that does not drift with them is quietly wrong within two quarters.
The point of benchmarks is not to grade yourself against strangers — it is to notice when your internal targets have drifted out of contact with the market you actually operate in. Set the payback ceiling deliberately, derive the acquisition targets from it mechanically, and paid media stops being a faith-based line item. The acquisition-side playbook these targets plug into is in the SaaS paid acquisition piece, and payback-governed acquisition is exactly how our SaaS PPC practice operates.
What is a good CAC payback period for SaaS in 2026?
It depends on segment, and the old universal 12-month rule now describes top-third rather than median performance. Recent benchmark datasets put the B2B SaaS median around 15 to 16 months, improved from roughly 18 a year earlier, with the top quartile at 6 months or under. By segment: 8 to 12 months is healthy for SMB-focused SaaS under about 15k ACV, 14 to 18 for mid-market, and 18 to 24 is normal at enterprise ACVs.
How do you calculate CAC payback correctly?
Divide fully-loaded sales and marketing cost — salaries, tools, agency fees, creative — by new ARR, then adjust for gross margin. The gross-margin adjustment is the step most often skipped, and the revenue-unadjusted version flatters results by 20 to 40 percent, which is enough to turn a genuine problem into a fake success. If payback looks suspiciously fast at enterprise ACV, the usual cause is under-loaded CAC such as sales-engineer time left out.
Is LTV:CAC or CAC payback the better metric?
Both, for different jobs. LTV:CAC is a portfolio check — below 3 acquisition returns too little, far above 5 you are probably under-investing in growth — but LTV is a projection you control, so nudging the churn assumption makes any ratio achievable. CAC payback uses only observed cash, which makes it the better governor of month-to-month spend. When the two disagree, trust payback, because it is harder to lie to.
How do you turn SaaS benchmarks into a paid media target?
Four steps. Pick a payback ceiling from your segment band and cash position. Multiply that ceiling in months by monthly gross-margin contribution per customer to get allowable fully-loaded CAC. Subtract per-customer sales cost and divide the remainder by your lead-to-customer rate to get a maximum cost per qualified lead. Then hand that number to the campaigns and revisit it quarterly, because win rates, margins and cycle lengths drift, and a static target is quietly wrong within two quarters.
Written by The ADSRUNNER team. If this resonated and you want to apply it to your own account, you can Take the growth check or run a free audit.
How we research, source figures, and handle corrections: editorial policy.
